Moment-based quantile sketches for efficient aggregation
Quantiles or their equivalents (percentiles) are commonly used in data exploration workflows. However, they can be expensive to compute on increasingly high-volume, multi-dimensional datasets. In order to reduce query response times, data systems make use of sketch data structures to accelerate quantile computations and deliver approximate results.
In this post, we show how a set of statistics including \(\sum x^2, \sum x^3,...\) can be used to define a compact and efficient sketch: the moments sketch. The key property of this sketch is that it can be updated and merged with very low overhead, and is optimized for use on large aggregations. The moments sketch can process quantile queries 15x faster than alternative sketches, and delivers 7x faster end-to-end query time speedups when incorporated into the Druid and Macrobase query engines.
Query processing using sketches
As an example application, our collaborators on a cloud services team at Microsoft collect billions of metrics daily from millions of heterogeneous mobile devices. Each metric is associated with metadata such as the location, application version, and os version, while analysts issue queries comparing quantiles across different metadata values. For instance, comparing the 99th percentile response latency across different application versions can reveal applications bugs and performance regressions.
However, scans over the billions of rows of raw data are too slow for interactive analysis. As a result, query engines such as Druid and Spark support computing approximate quantiles using quantile sketches (e.g. a histogram, subsample, GK sketch, etc…) of the data. Quantiles can then be directly estimated from a sketch without sorting and scanning over the raw values.
Inspired by Druid, our collaborators at Microsoft further reduce query latencies by pre-computing sketches for each time period and combination of dimension values. We can then estimate quantiles across a variety of possible dimensions by merging the relevant pre-computed sketches. Sketches which can be merged this way without loss of accuracy are called mergeable summaries.
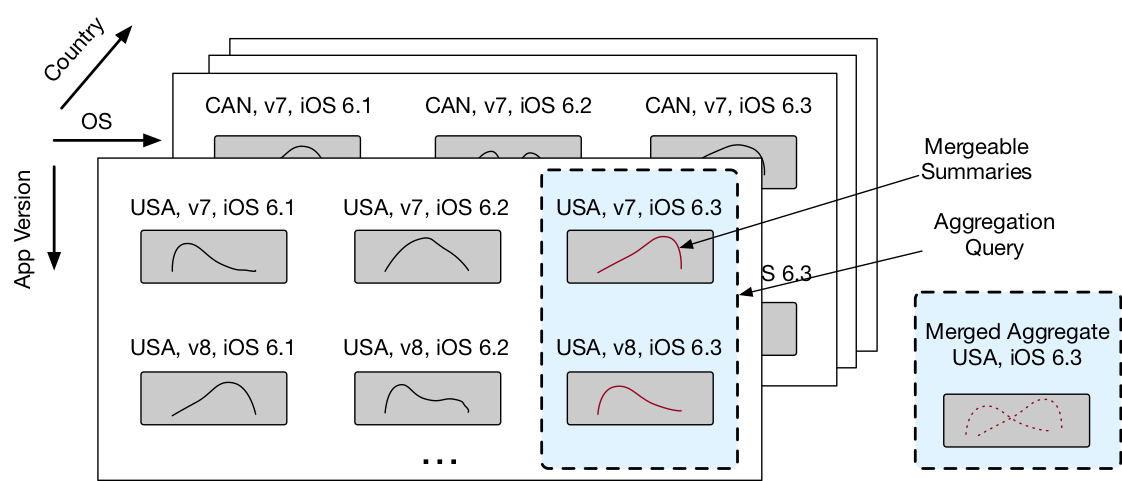
In a deployment with dozens of categorical dimensions, aggregations can require merging millions of sketches, one for each combination of dimension values. This is often still cheaper than scanning the billions of rows directly, but merging sketches is a bottleneck. For instance, a Greenwald Khanna (GK) sketch requires 3 microseconds per merge, so aggregating 1 million GK sketches will incur at least 3 seconds of overhead.
Moments: Simple and informative statistics
To support the aggregations described above, we make use of a simple and informative set of statistics: the moments. The moments \(\mu_i\) are the averages of powers of values in a dataset: \(\mu_i=\frac{1}{n}\sum x^i\). They generalize the mean and variance and describe the shape of a distribution. As an example of their use, Markov’s Inequality quantifies how moments can provide bounds on the fraction of values above a certain threshold: if too many values are above a threshold then the moment would have to be higher.
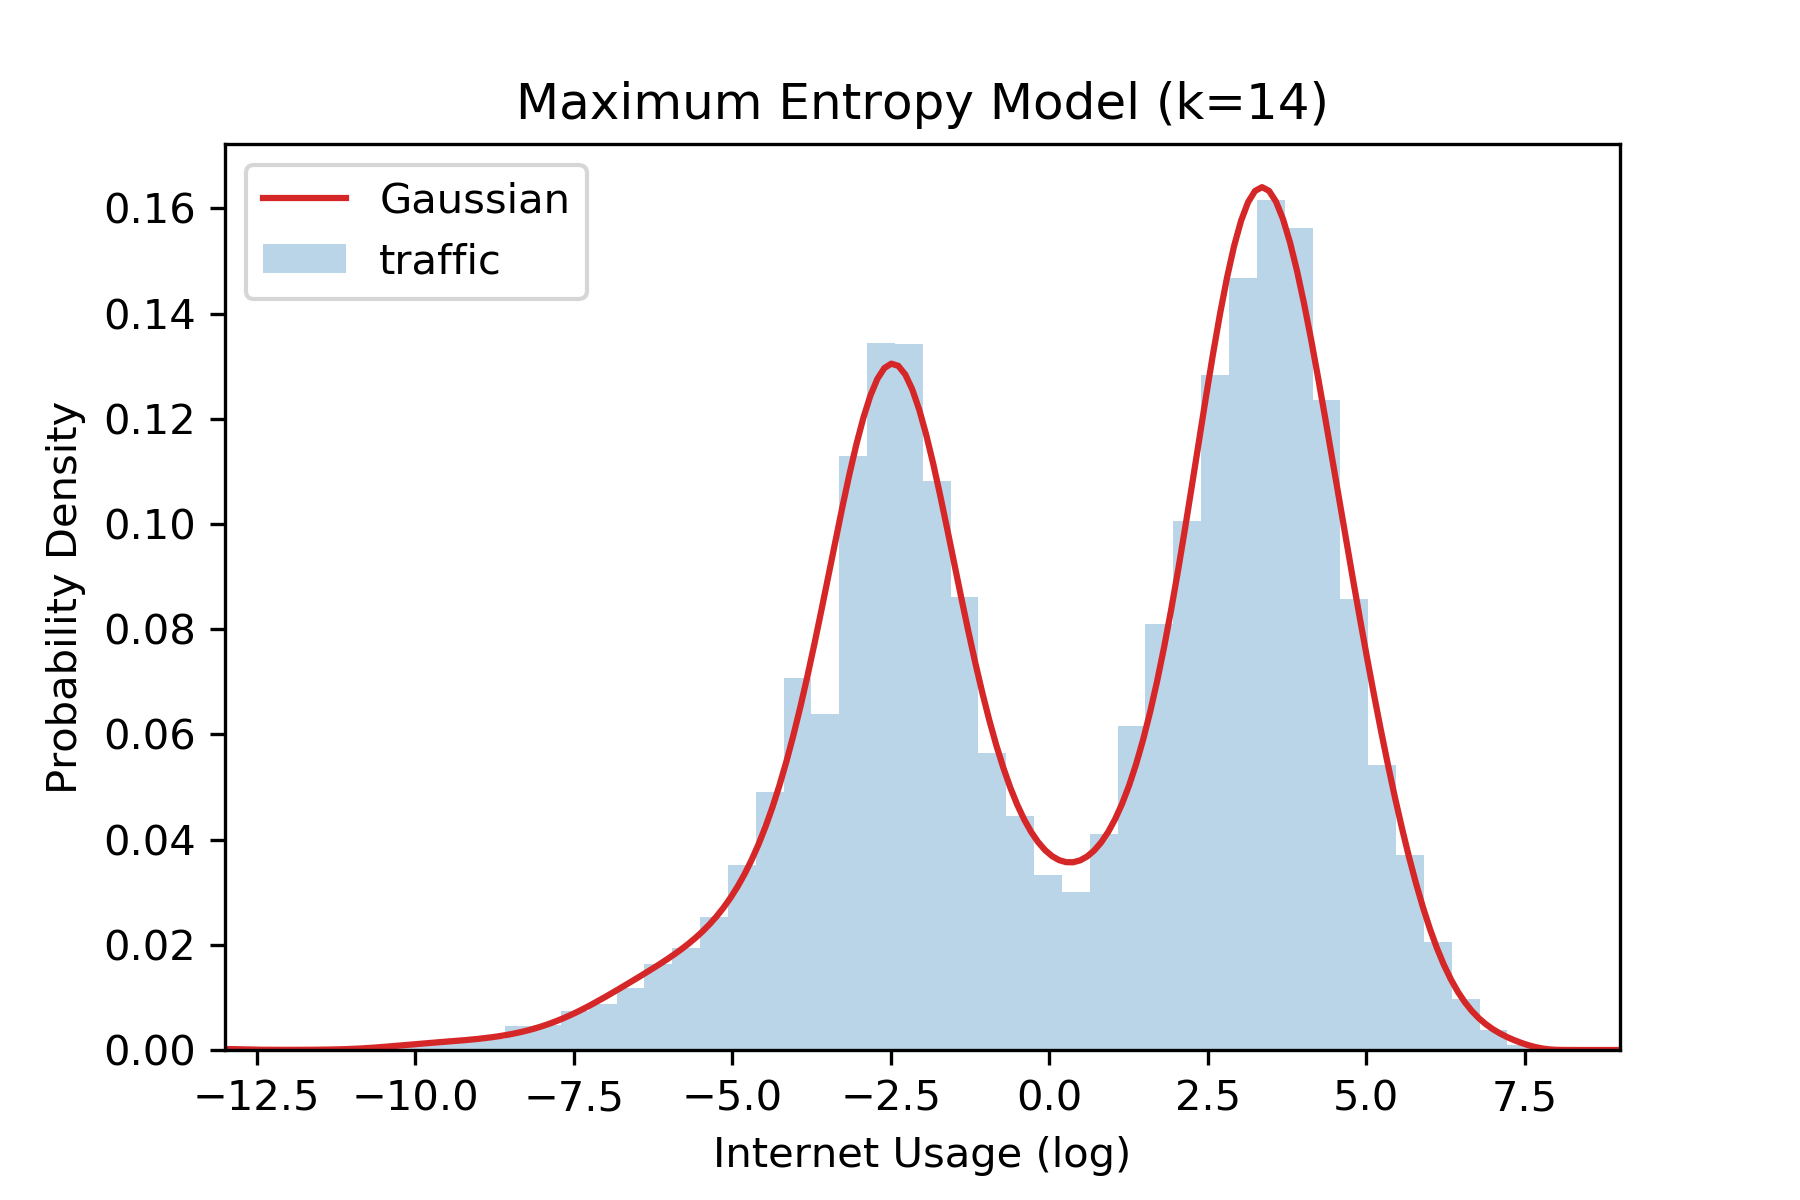
The moments can also be used to estimate quantiles. To do so we draw upon a rich literature in statistics, machine learning, econometrics, and physics and apply the method-of-moments to estimate distribution parameters within the space of Maximum Entropy distributions. These are distributions which maximize their uncertainty given a set of constraints, and provide accurate (<1% error) estimates on range of real-world datasets. Given an estimate for the distribution, we can then compute quantiles directly from this distribution estimate. In the figure below we illustrate how this procedure can provide accurate distribution estimates given \(k=14\) moments on the milan dataset. Though we can achieve good accuracy for continuous values, these methods are less reliable for discrete values.
The Moments Sketch
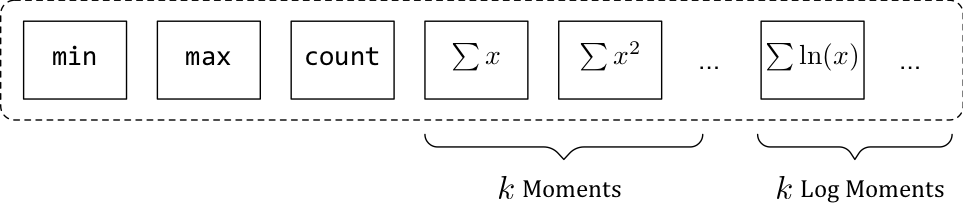
When faced with large-scale aggregations, we observe that the moments can serve as the key component of an efficient quantile sketch, which we refer to as the moments sketch. This sketch consists of an array of floating point values: the minimum, maximum, count, \(k\) moments, and \(k\) moments of the log-transformed data. Notably, this data structure can be merged using efficient primitive floating point operations. In practice we set \(k\) between 10 and 20 to achieve 1% error.
Then, in order to estimate quantiles from this sketch, we apply the method-of-moments and find the maximum entropy distribution as described earlier. We do so by solving for a distribution pdf \(f\) whose moments match those tracked by our sketch, and whose entropy is maximized under these constraints. Solving this convex optimization problem can be numerically complex. Naive implementations are both slow and unstable, so we have developed a variety of techniques that allow us to find the maximum entropy distribution and estimate quantiles for a sketch in under 1ms, compared to the 300ms required when using off-the-shelf solvers such as cvxpy. These optimizations include:
- using Chebyshev polynomials to improve numeric stability,
- developing specialized numeric integration routines,
- selectively incorporating the most informative moments,
and for more details please see the paper.
Performance Results
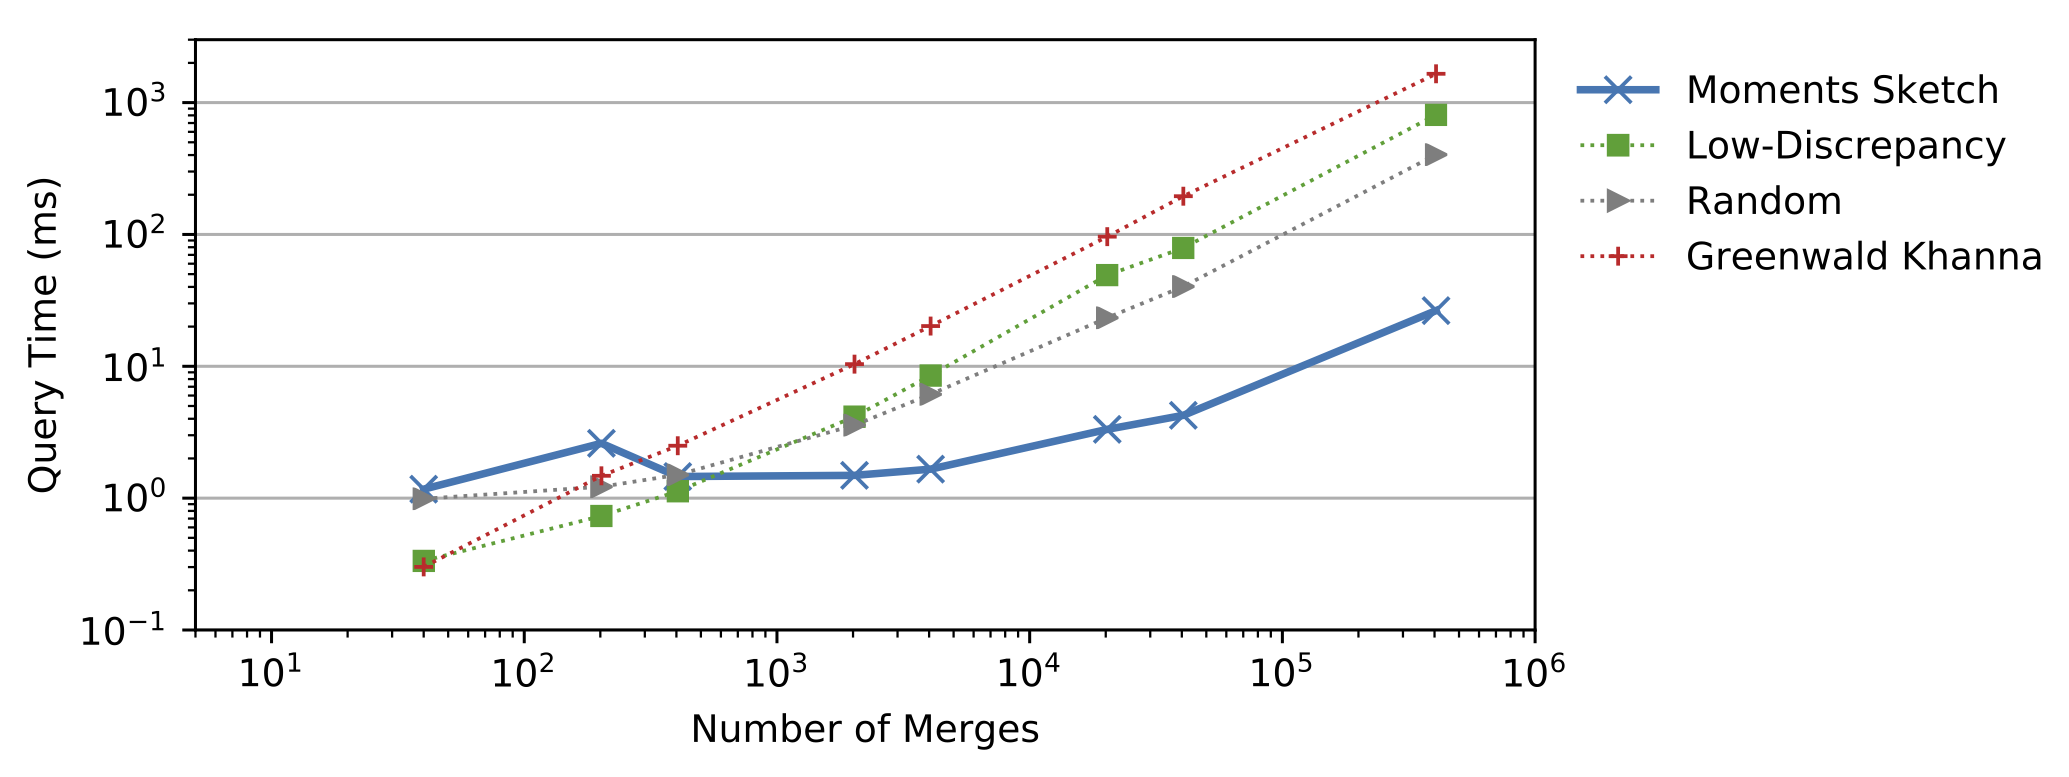
The moments sketch is most useful when merge and update time are bottlenecks. In the figure below, we show how as we increase the number of merges required to process a query, fixed overheads from the maximum entropy optimization routine are outweighed by the costs of merging. Beyond around 10 thousand merges the moments sketch outperforms other high-performance mergeable sketches including the “Random” sketch, the low-discrepancy mergeable sketch, and the Greenwald Khanna sketch.
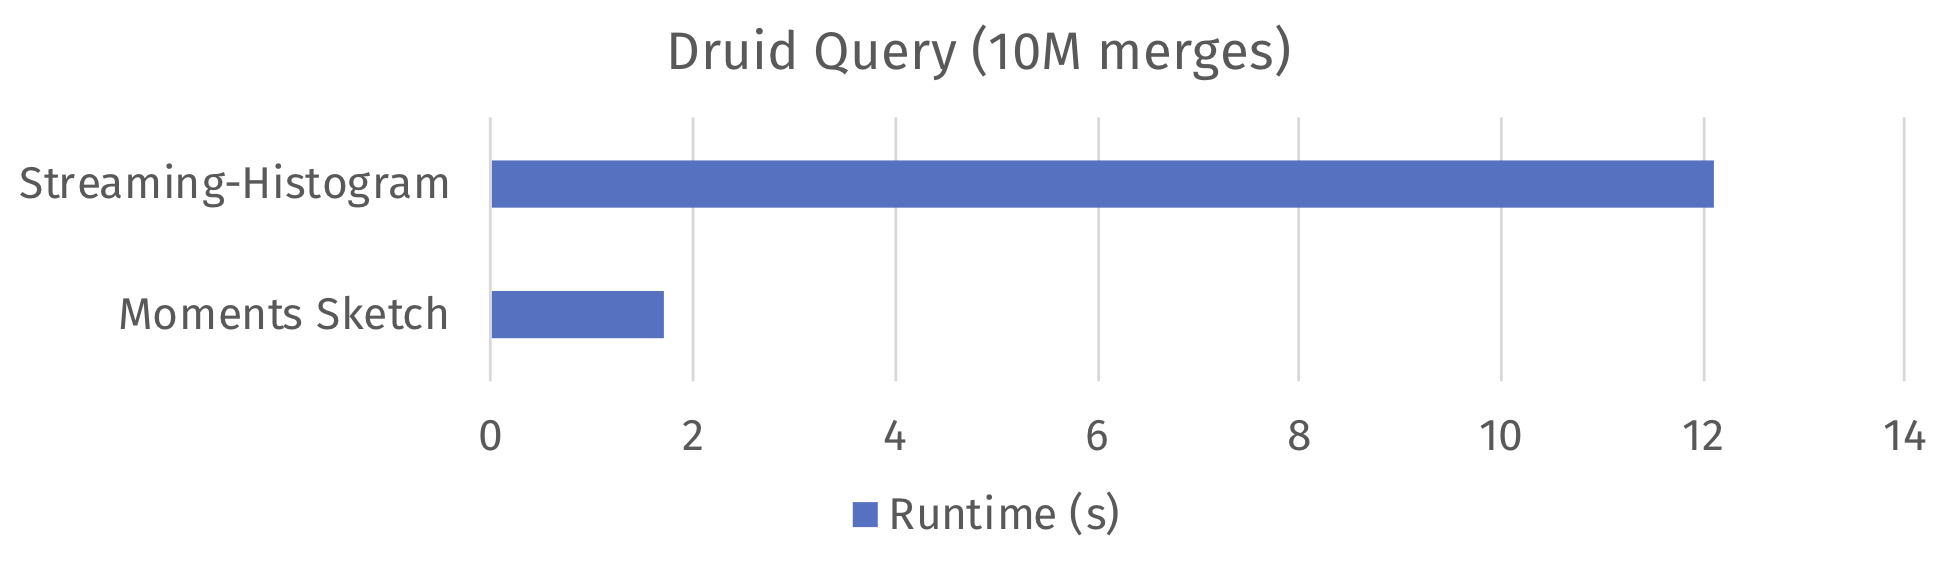
To illustrate the impact the moments sketch can have on production data systems, we implemented the sketch as a custom user defined aggregate and incorporated it into a Druid deployment. When computing a quantile query requiring 10 million merges, the default streaming-histogram sketch in Druid 0.11 provides 12 second query times. Replacing this sketch with our moments sketch brings the query time down to 1.7 seconds, a 7x improvement. Both sketches were tuned to provide 1% error on a benchmark dataset. We observed similar results when we incorporated the moments sketch into the MacroBase engine: efficient usage of the moment sketch provides again a 7x speedup over using the low-discrepancy mergeable sketch.
Conclusion
When interactive response times are a concern, the moments of a dataset (e.g., \(\sum x^2, \sum x^3,...\) ) serve as lightweight summaries a distribution, enabling low-overhead analytics on high-dimensional data. These statistics are easily incorporated as a sketch data structure into analytics systems such as Druid, Spark, and MacroBase, improving their performance on large quantile aggregations. Moreover, efficient techniques for the method-of-moments provide us with a way to estimate accurate quantiles in less than 1ms.
For more information including an evaluation with other sketches and details on our maximum entropy solver, see the associated paper presented at VLDB 2018. Our code for the benchmarks and the moments sketch estimator is open source. Please feel free to send us any feedback or questions at egan1@stanford.edu.