How do MLPerf v0.7 entries compare on cost?
MLPerf announced its v0.7 results recently, with sub-minute submissions from companies such as Nvidia, Google, Alibaba, Intel, and others. While this is exciting, many of these entries are fundamentally hard to compare, since they use different numbers and types of accelerators. Consequently, it is still challenging for an end user to determine the right accelerator type to use for their model and with what scale factor, particularly if the user has time or budget constraints.
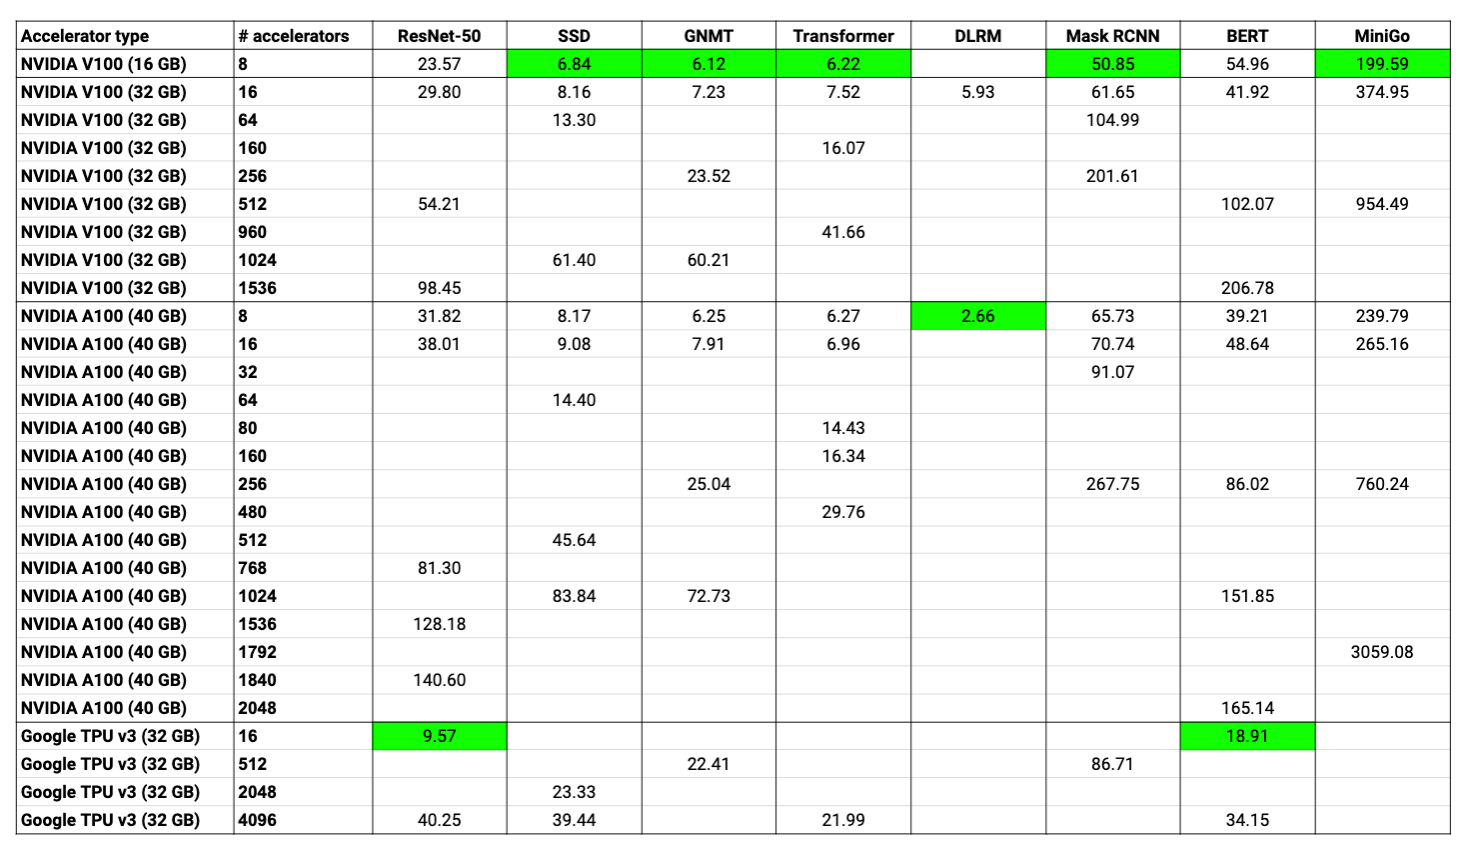
In this blogpost, we use GCP on-demand instance prices1 to compare different MLPerf v0.7 entries2 – this helps quantify the effect of scaling out to more accelerators, and the effect of switching accelerator types. For simplicity, we restrict our analysis to entries using V100 and A100 GPUs, and the TPU v3. Costs can be estimated in many ways: we believe using cloud costs is the easiest way, even though it is not perfect. In our analysis, we only considered the cost of accelerators (and ignored the cost of CPUs, storage, and networking), since accelerators dominate total cost; additionally, we had to make assumptions with the per-hour costs of certain accelerator types, since the A100 and 32-GB TPU v3 chips are not yet publicly available on GCP (for the A100, we extrapolated from costs of V100 and A100 Lambda Hyperplane servers3). We show a table of the costs to reach target accuracies below.
We are also making our numbers public in this spreadsheet, which makes it easy to play with different per-hour costs (a copy of the spreadsheet will need to be made first: “File -> Make a copy”).
To see how cost-to-accuracy compares to time-to-accuracy for these entries, we show a scatterplot of cost (in dollars) versus runtime (in minutes) using the same per-hour prices as above.
One could try to compare entries based on Total Cost of Ownership (TCO) or power usage as well, but these are harder to estimate.
We think other interesting analyses can be performed on top of these results as well. In particular, one could try to answer questions of the form:
- Which software framework should I use?
- How well do these entries scale? Do they take the same number of epochs to reach the target accuracy threshold?
- How do the best TTAs compare to the previous versions of MLPerf (v0.5 and v0.6)? What are the major sources of improvement?
We are excited to see what the community comes up with!